Table of contents
Test Coverage Copy link to clipboard
Test coverage is a metric that describes to which extent your code is covered by your tests. Translated to statechart modelling, a test coverage describes which parts of your state machine were activated during test execution. This information allows to identify missing tests and thereby to increase test quality.
Whenever a test set is executed, a test coverage is computed on the fly. The test coverage metrics can be examined in the Coverage View. The coverage value is given in percent for each model element and is defined as follows:
- Transition coverage is 100% if the transition is executed at least once, and 0% otherwise.
- A state is covered if it is entered and all of its outgoing transitions are covered.
- Region coverage is the weighted average coverage of all contained states.
- Statechart coverage is the weighted average coverage of its top level regions.
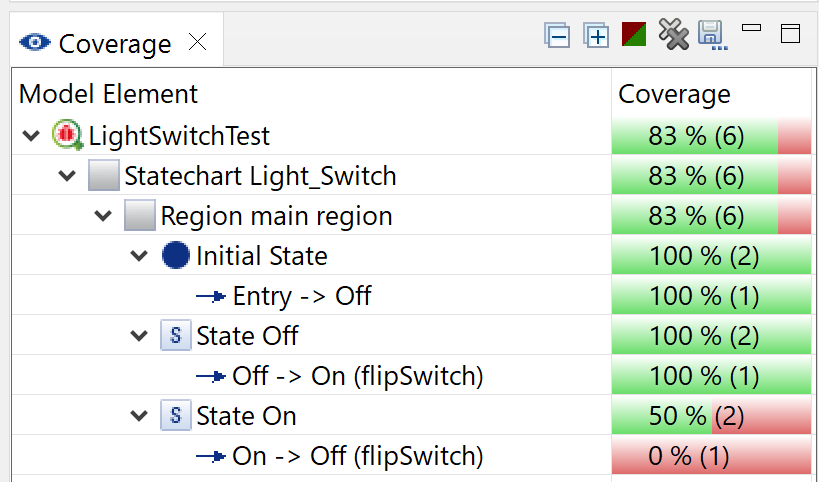
In the following example you can see that state On has a coverage of 50%. Although it is entered by the tests, its outgoing transition On -> Off is not covered.

The coverage view contains the following toolbar buttons:
-
 : Shows / hides fully covered elements in the tree
-
 : Clears the view and removes the coverage highlighting in the model
The coverage highlighting feature transports the coverage values directly onto the statechart model by coloring all elements in the colors:
- green (fully covered),
- yellow (not fully covered), and
- red (not covered at all).
You can enable the highlighting by selecting an arbitrary element in the coverage view.

With the latest 5.2.0 update, we’ve introduced a useful feature: coverage files that are now generated and saved on your computer. These have the extension “.cov” and can be saved alongside the corresponding SCTUnit file in your workspace. This allows you to easily compare your current coverage results with past ones to see how test coverage is improving over time.
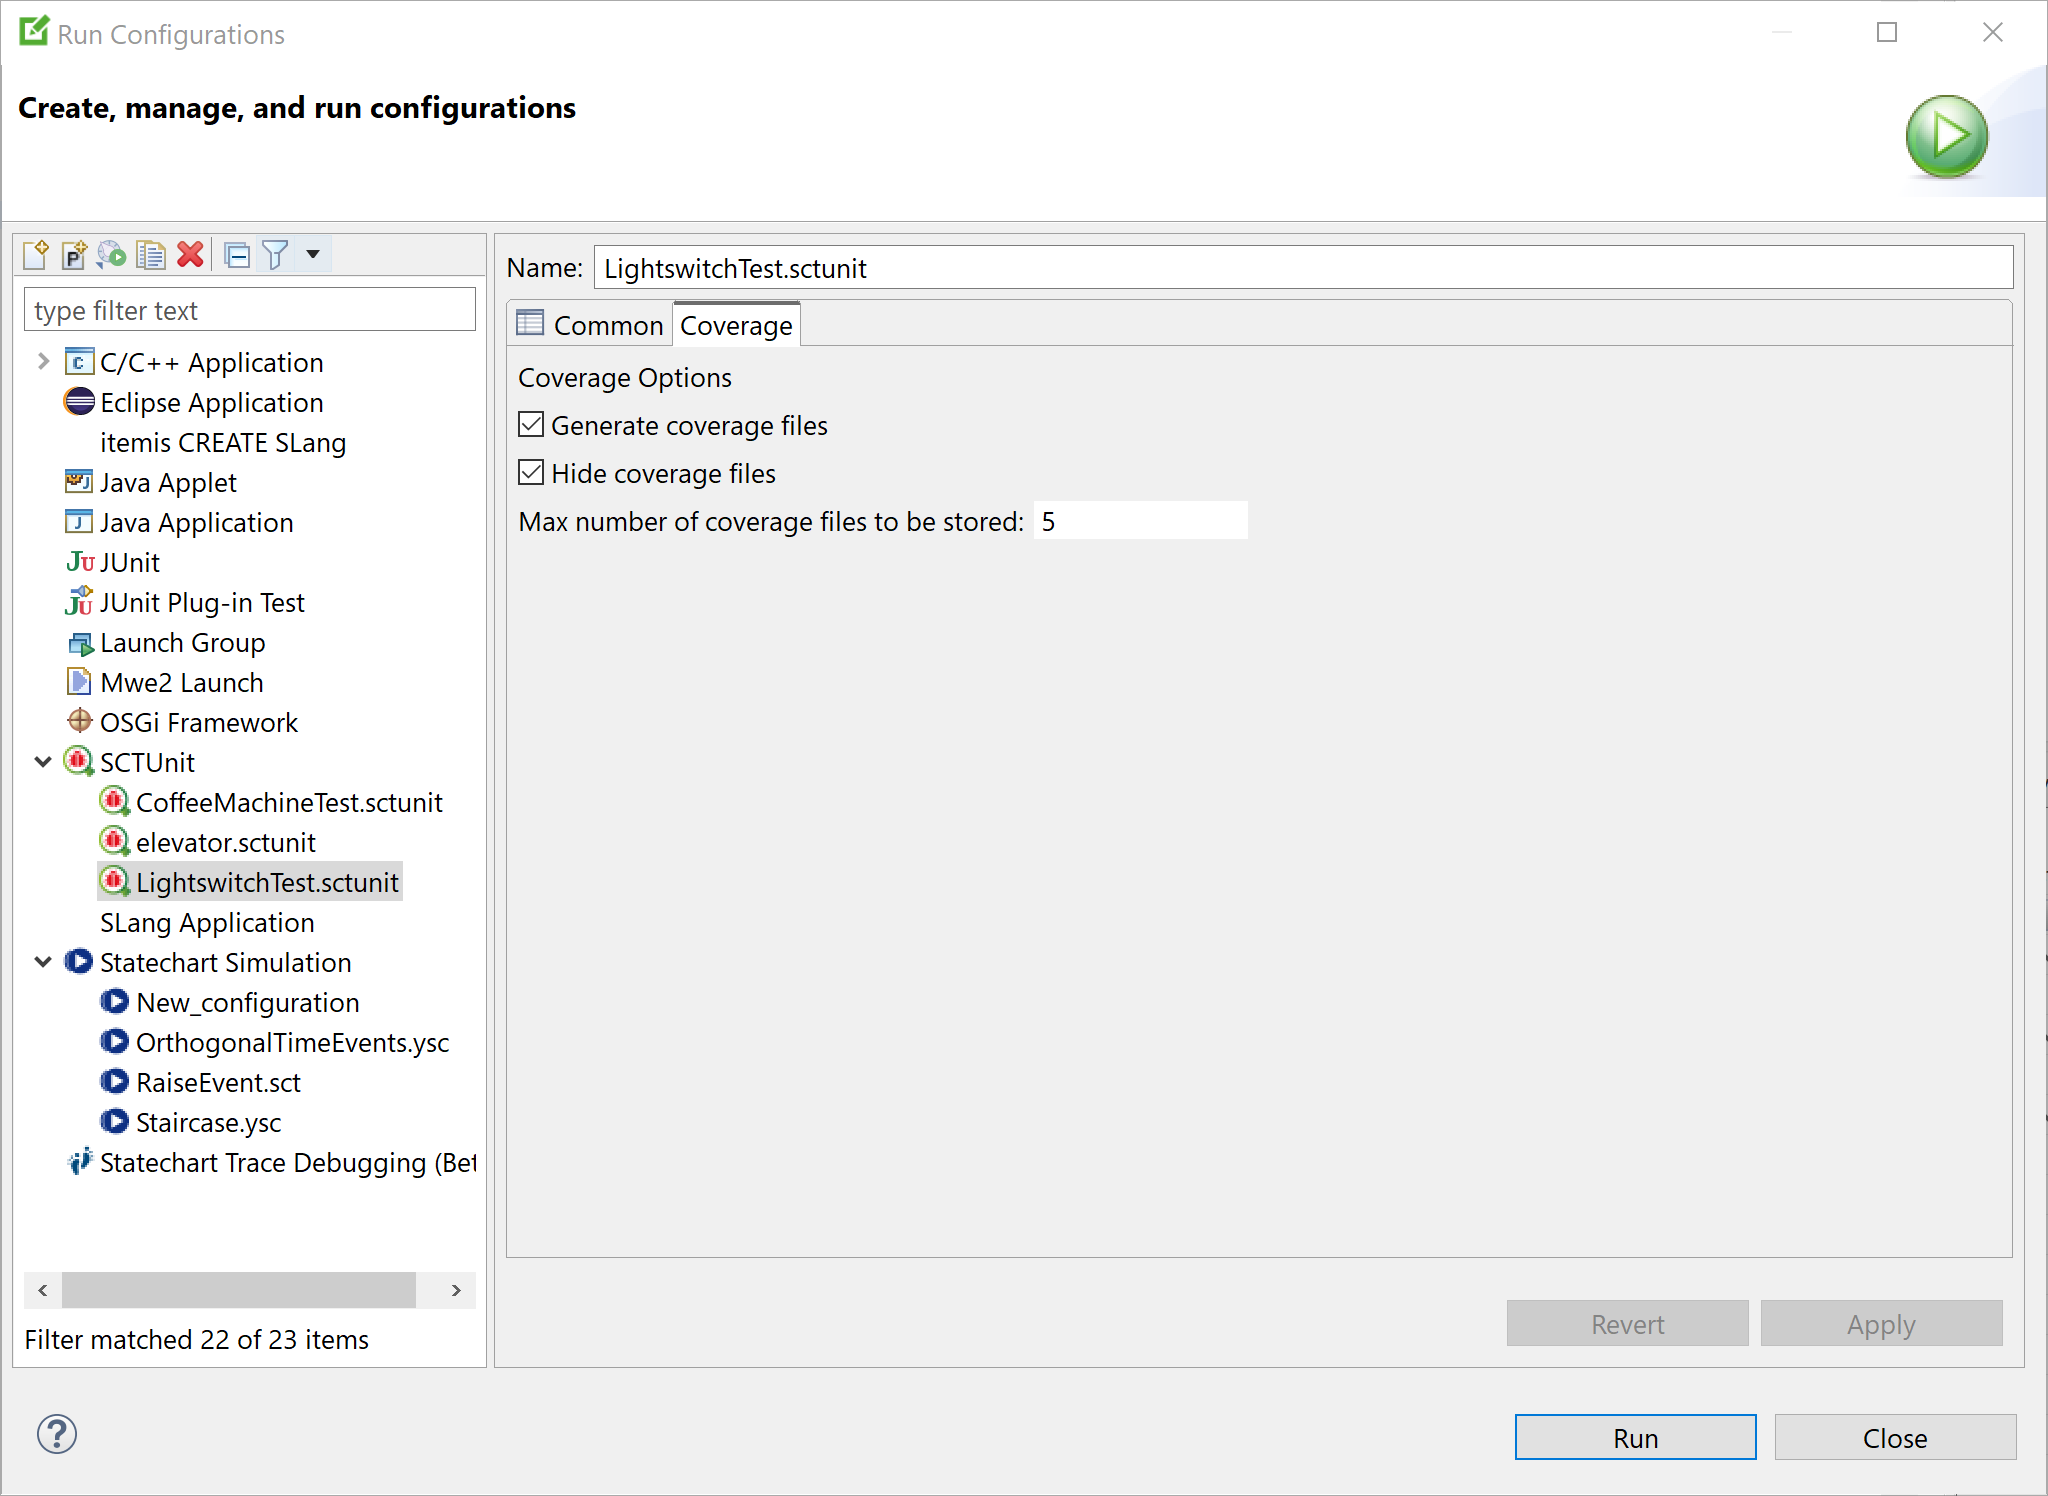
We’ve also made it convenient for you to set your SCTUnit Coverage preferences. Just head over to the SCTUnit “Run Configurations” and look for the new “Coverage” tab right next to the “Common” tab. This lets you adjust coverage settings according to your preferences.

Switching between SCTUnit Editors will now automatically load the most recent previously calculated coverage. This avoids the need to recalculate any coverage information.
HTML Coverage Report Copy link to clipboard
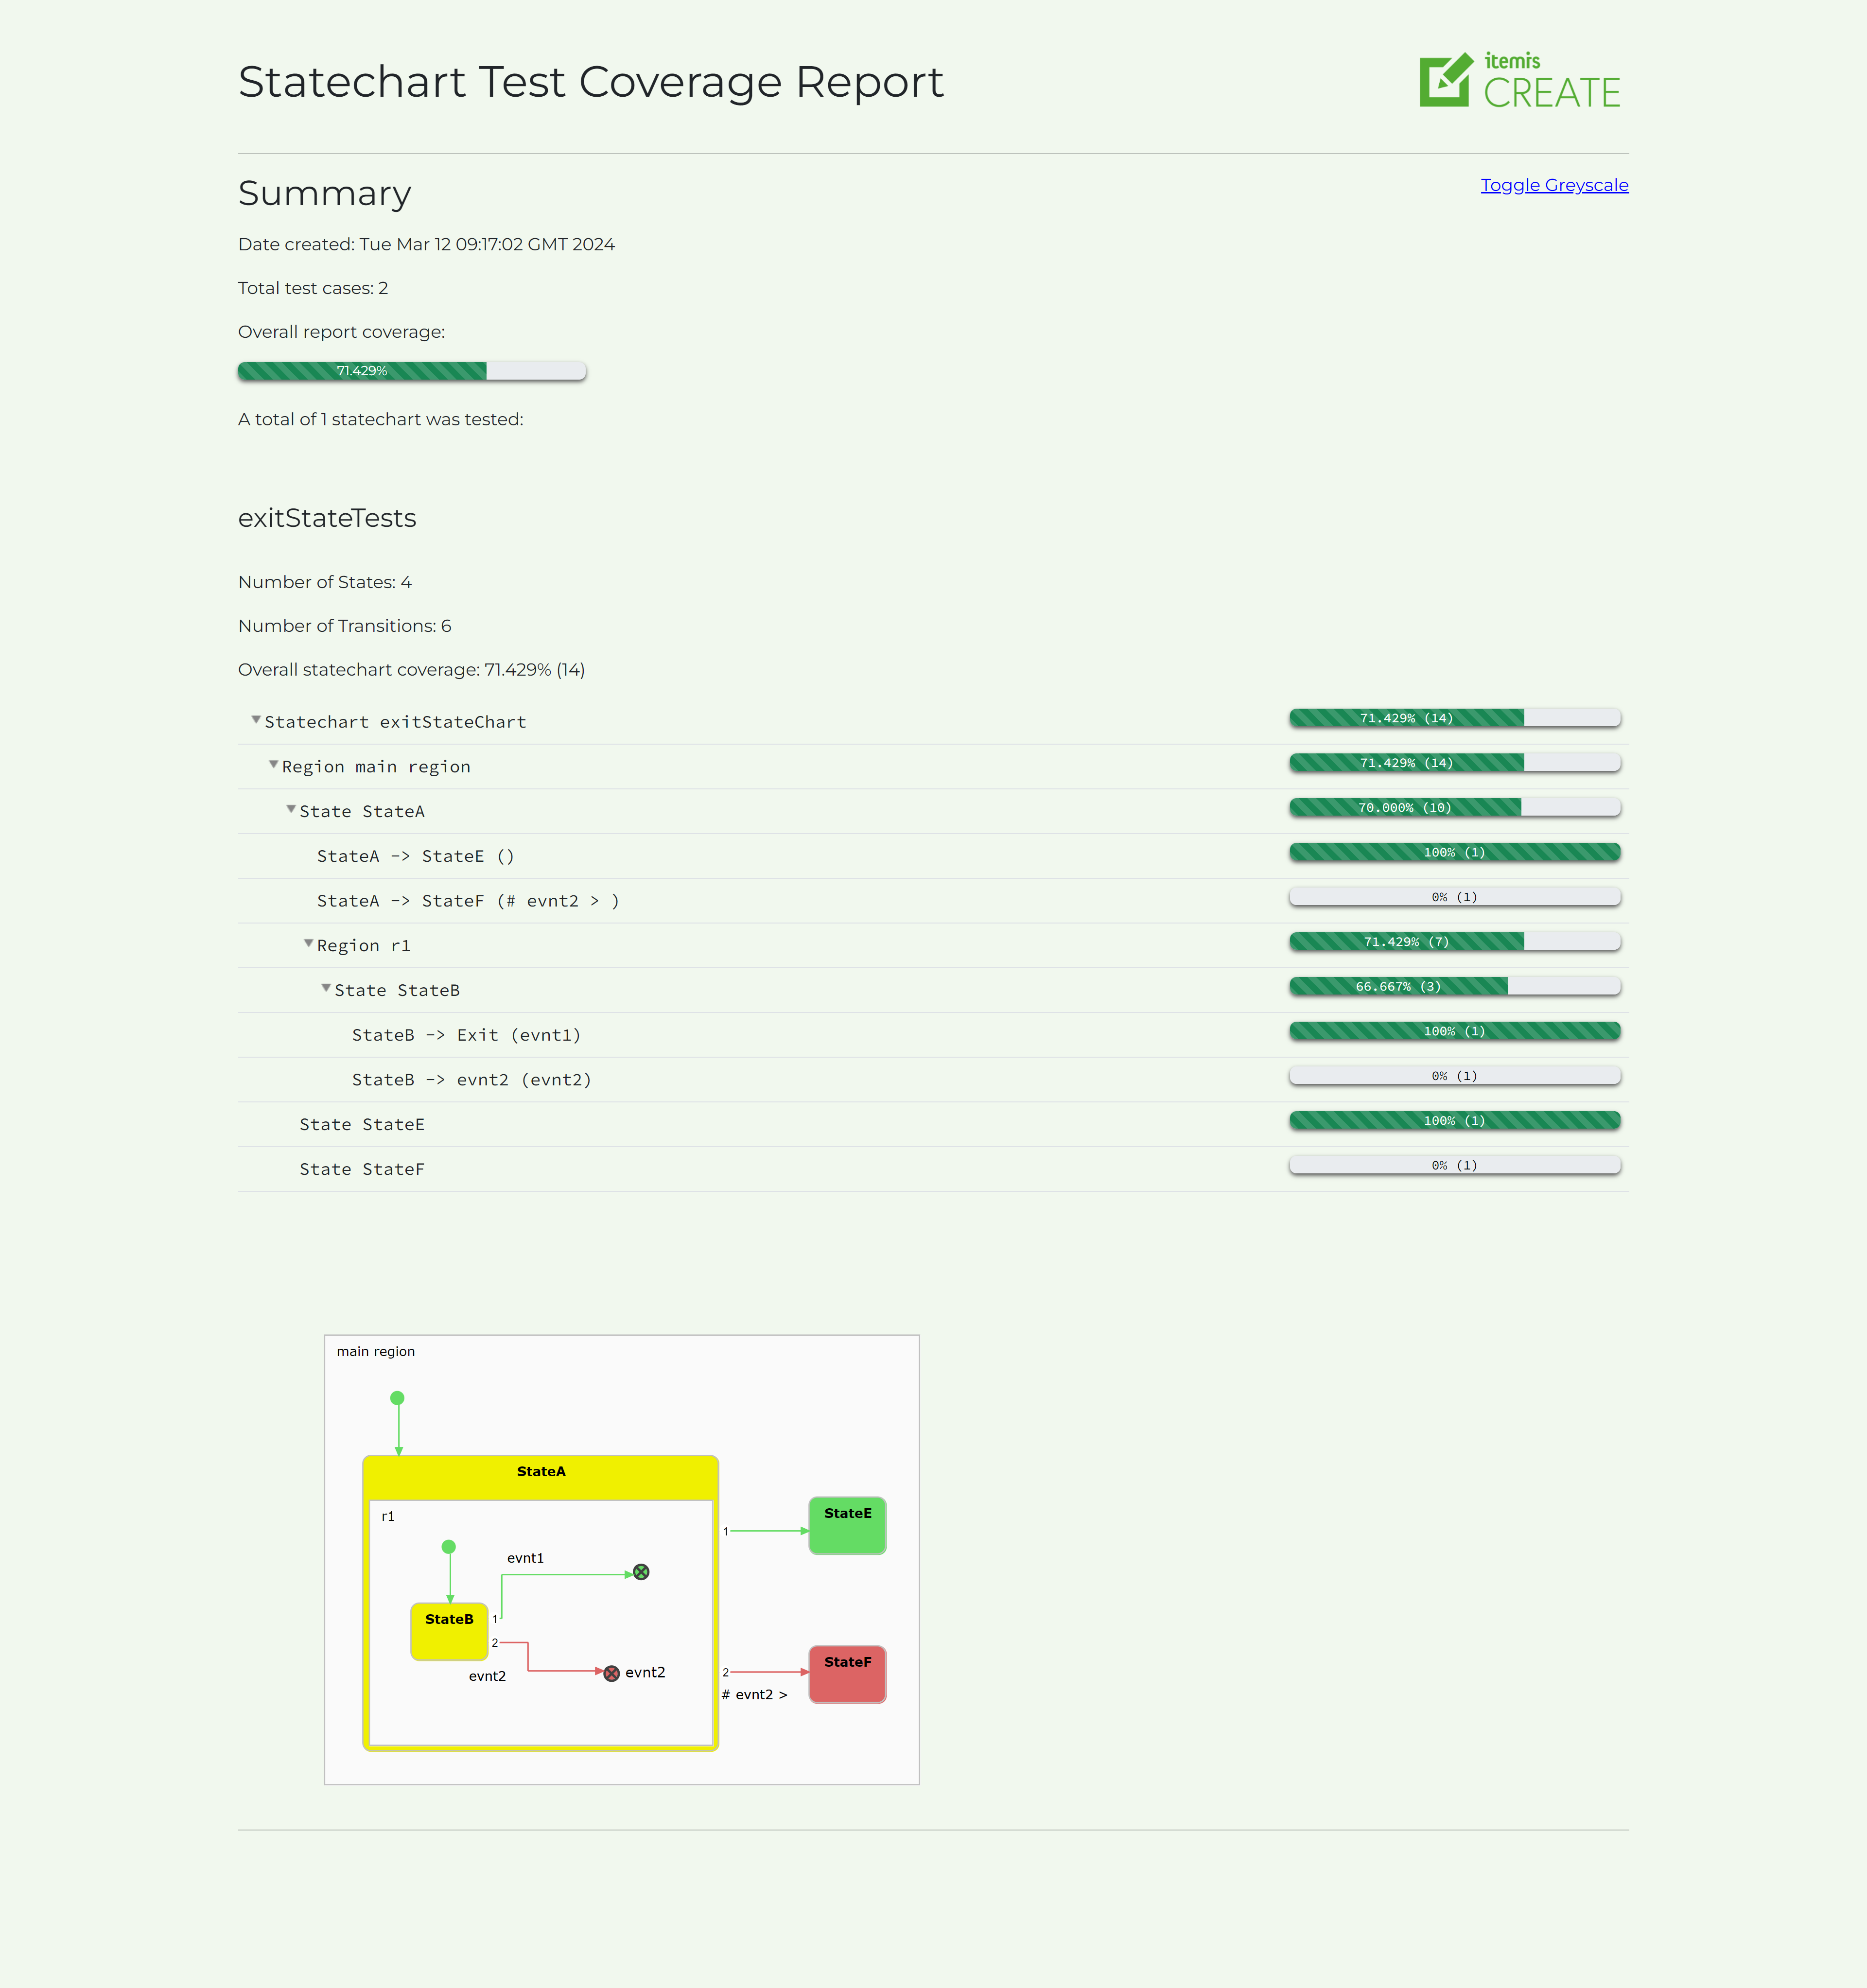
Also, it is now possible to export a HTMLreport of your test coverage. To do this, click the save icon once your coverage has been calculated.

A dialog will open allowing you to save the .zip file in the location of your choice. The HTML file contained can then be opened in your browser to view the report. The report contains all the information about the coverage of your tests as well as a highlighted image of each statechart covered by your SCTUnit tests.
