Table of contents
Overview of the „Analysis” perspective Copy link to clipboard
This section gives an overview of the Analysis perspective. You will find more detailed information in subsequent sections.
General project metrics: the dashboard Copy link to clipboard
The dashboard provides answers to typical questions in traceability projects. For answers to not-so-typical questions, please see the section on customized queries.
- Which kinds of trace links do we have and how many of each?
- What are the artifacts we have and how many of each type?
- Which of our artifacts have trace links to other artifacts, in total as well as broken down by artifact type?
- Which of our artifacts do not have trace links to other artifacts, in total as well as broken down by artifact type?
Read an introduction on requirements coverage and what itemis ANALYZE can do for you in this regard in the blog posts "What is requirements coverage and how can it be analyzed?" and "How to analyse your project status with itemis ANALYZE".
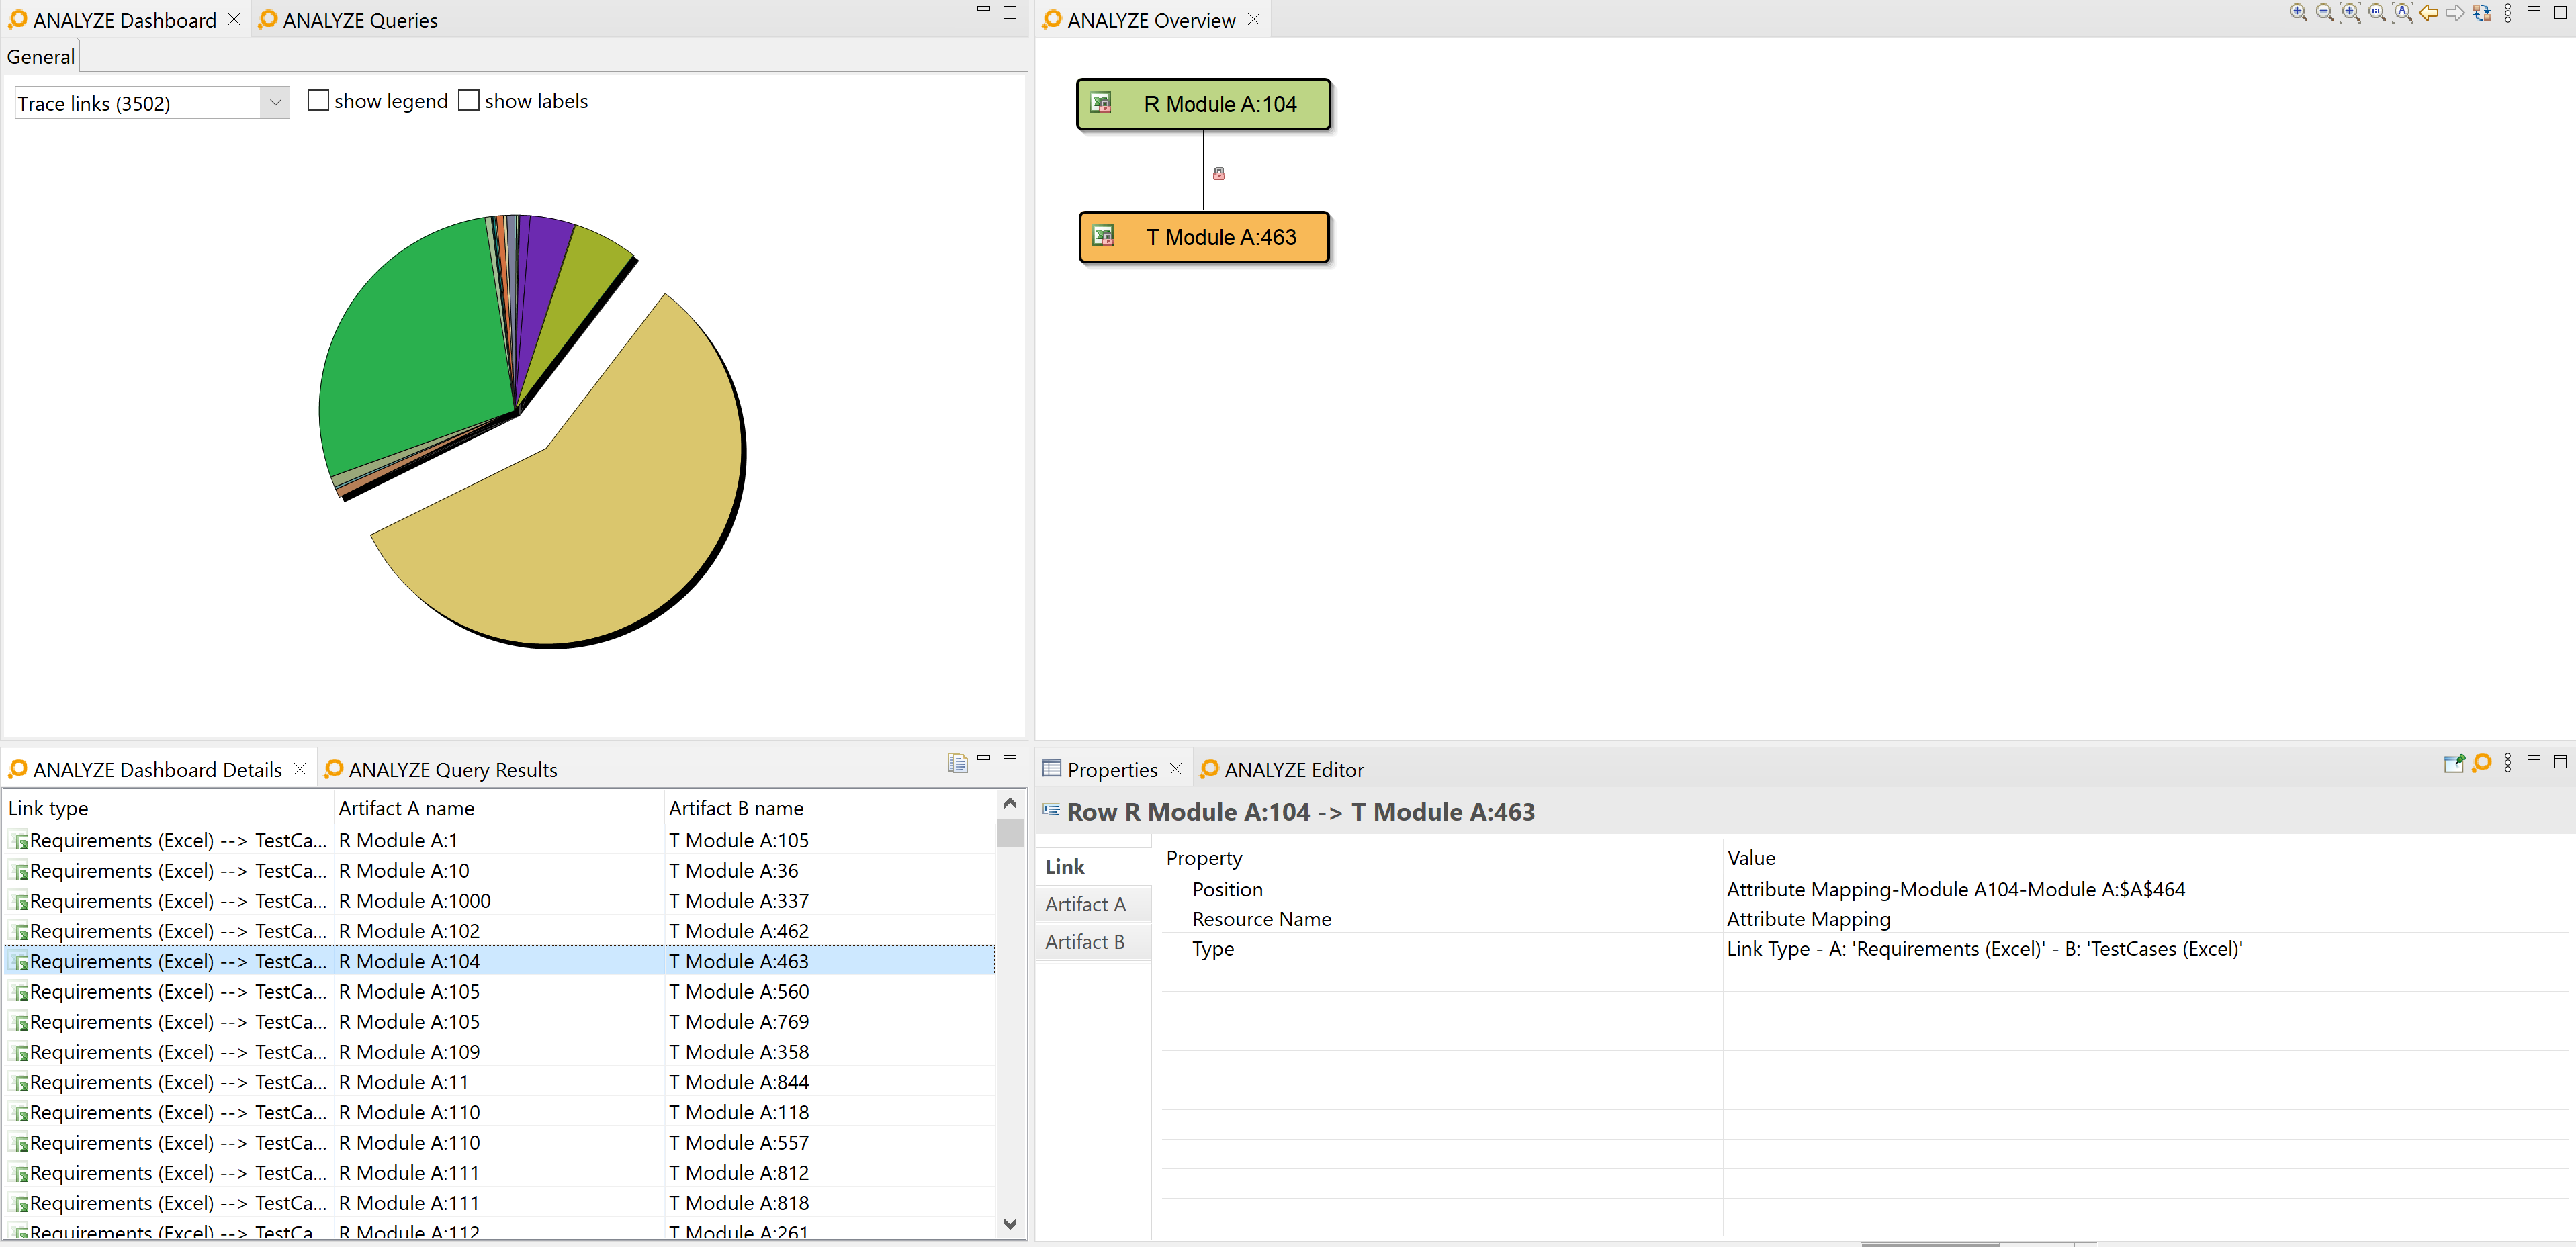
Figure "The Analysis perspective; using the dashboard" exemplifies how this can look like:
- The ANALYZE Dashboard view (top-left) displays a breakdown of the linked artifacts, including their numbers. Each pie chart section represents a different artifact type.
- Selecting one or more pie chart sections makes them explode and displays their contents (here: artifacts) in the ANALYZE Dashboard Details view (bottom-left).
- Selecting an artifact in ANALYZE Dashboard Details displays its properties in the Properties view (bottom-right) and its relationships to other artifacts in the ANALYZE Overview view (top-right).

The Analysis perspective; using the dashboard
Section "The ANALYZE Dashboard view" has more details on using the dashboard.
Writing and running customized queries Copy link to clipboard
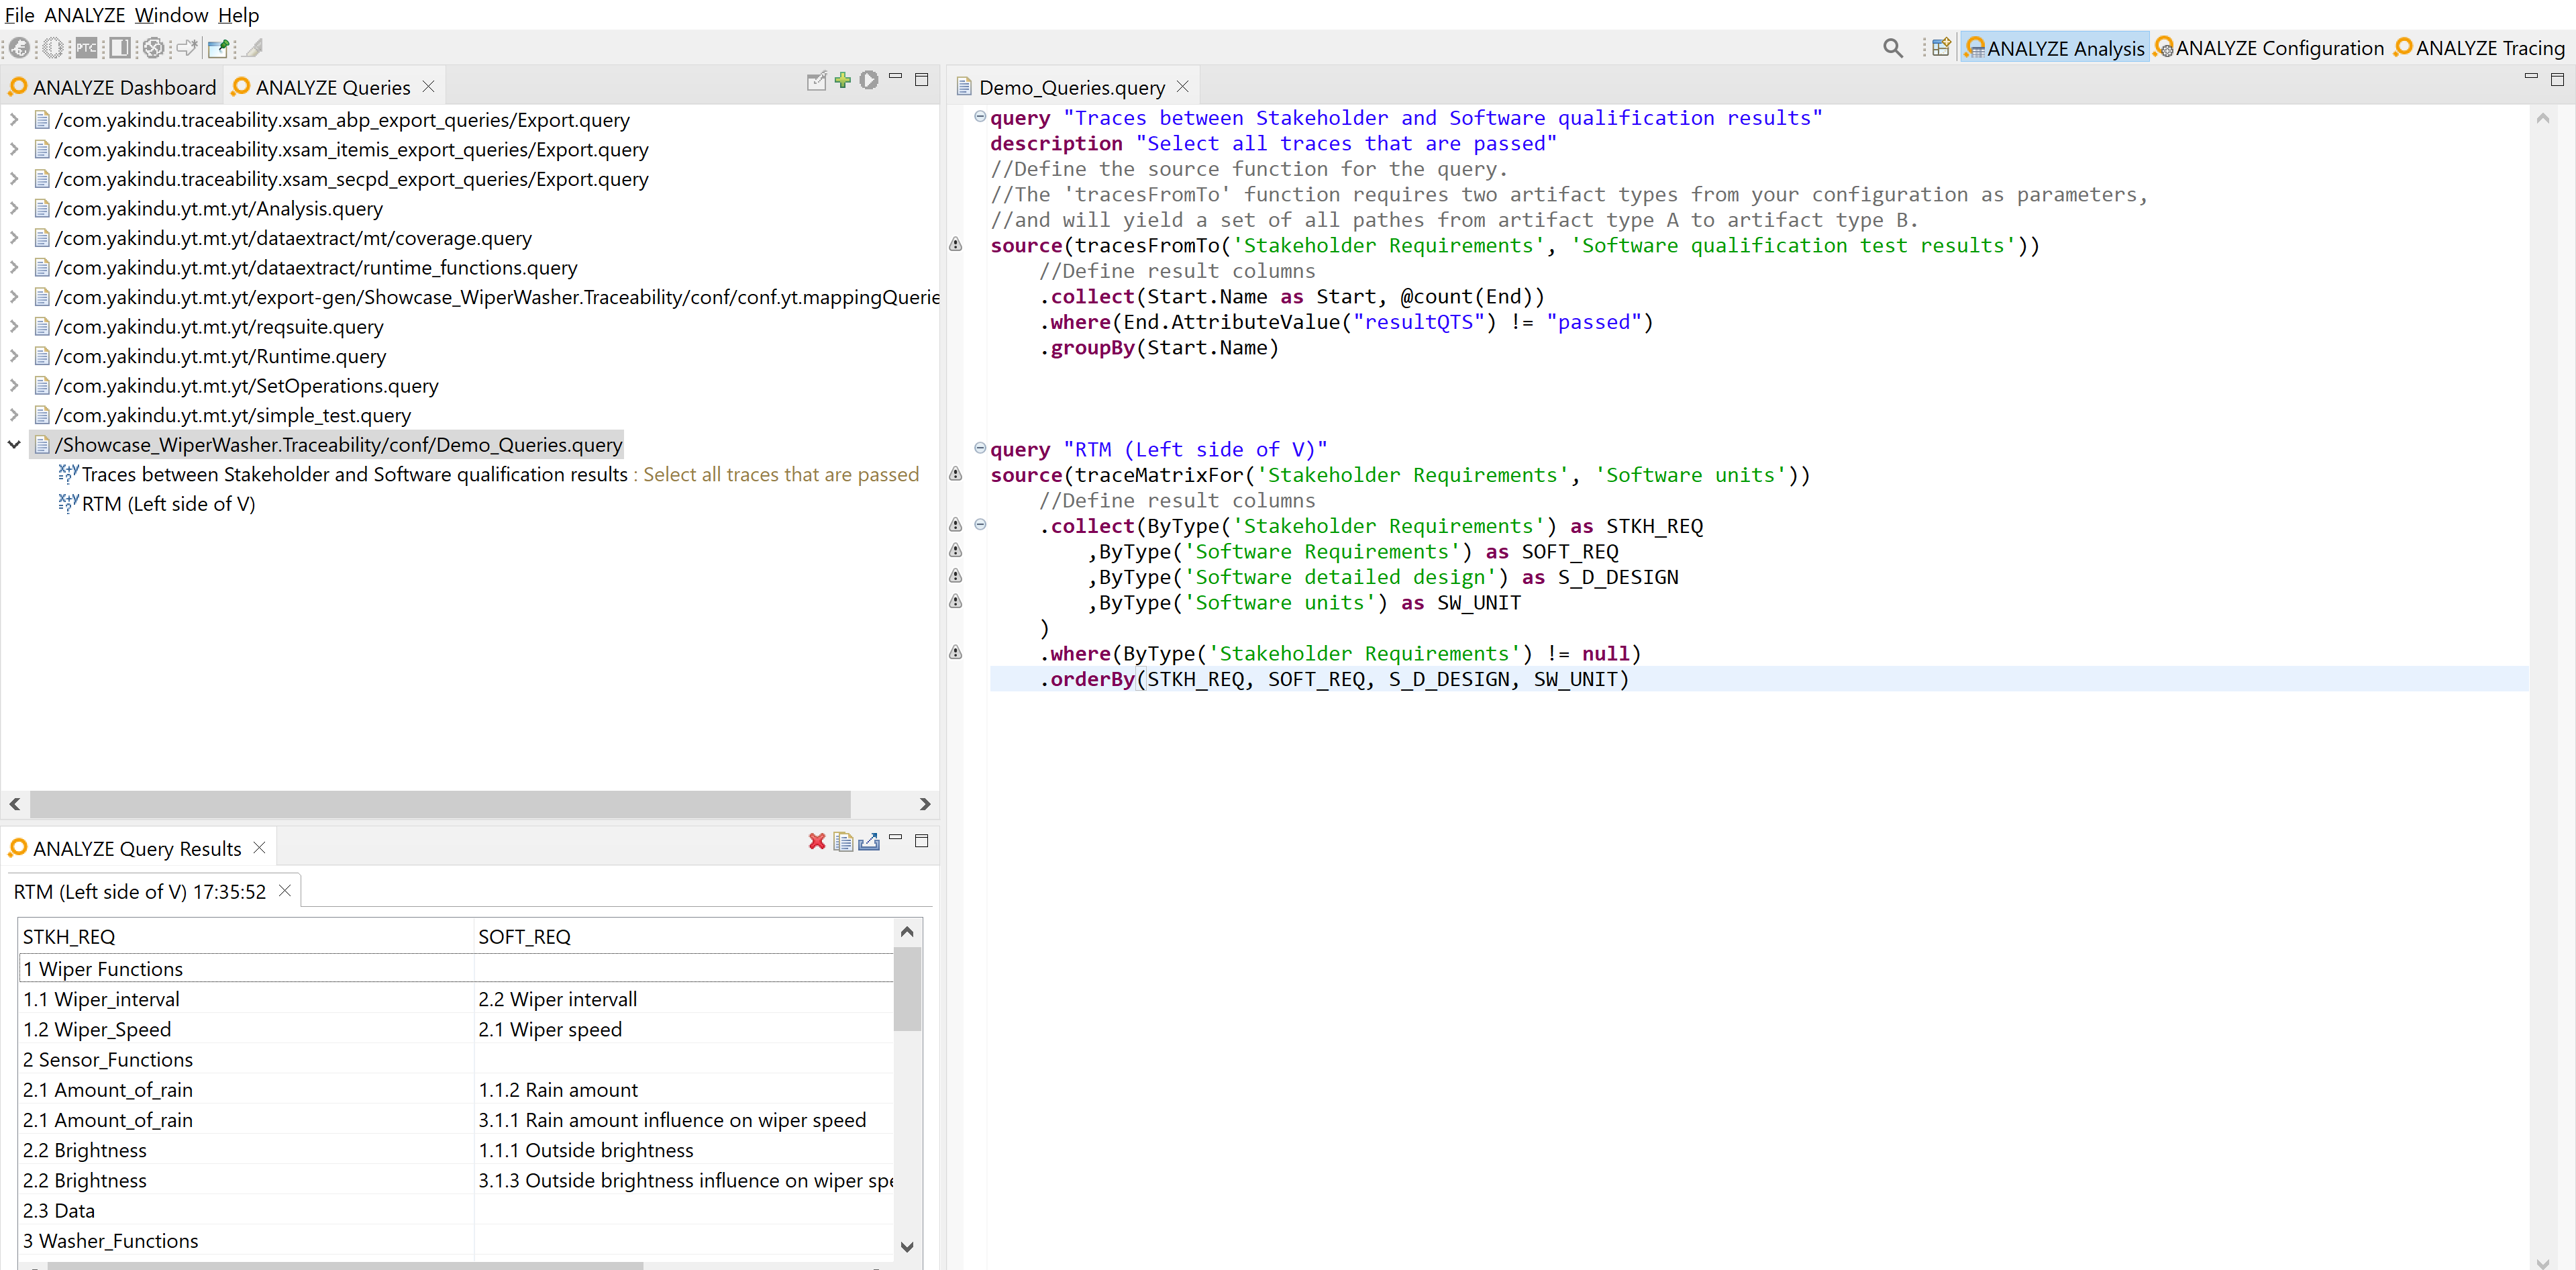
While the dashboard application answers common questions, it does not cover any specific needs of your particular project. However, this can be addressed with customized queries. Figure "Writing and running queries in the Analysis perspective" shows an example:
- Hand-crafted queries in the ANALYZE query language have been established in a .query file (right). In this example, the idea is to trace stakeholder requirements to the results of software qualification tests, but only to those tests that have been executed successfully.
- The ANALYZE Queries view (top left) shows a tree view of query files (here: only one) and the queries therein.
- Double-clicking on a query executes it. Results are shown in the ANALYZE Query Results view (bottom left).

Writing and running queries in the Analysis perspective
Section "The ANALYZE Queries view and the ANALYZE Queries results view" has more details on working with customized queries.